采集端(前端)配置
3.1 Syslog日志采集
3.1.1 交换机日志采集
3.1.1.1 配置配置
# set system log-level info
# set system log-facility 0
# set system syslog server-ip 172.76.20.119 port 7515
# set system syslog server-ip 172.76.20.119 protocol udp
# commit
提示
- 交换机日志采用udp协议
- 不同品牌交换机设备的配置命令不相同,详细可查看对应交换机的官方使用说明。
3.1.1.2 验证
查看
GET /syslog-2020.10.23-net/_search
{
  "size":40,
  "query":{"match":{"host":"172.76.20.193"}},
  "sort":{"@timestamp":{"order":"desc"}}
}
结果
"_source" : {
          "host" : "172.76.20.193",
          "message" : ": [MSTP]IF-PVST-TX(79) vlan(e014) 0000 02 02 7c 101468efbd261240 00000fa0 f01480a23530fb32 804f 0200 1400 0200 0f00",
          "facility_label" : "local0",
          "severity" : 6,
          "facility" : 16,
          "@timestamp" : "2020-10-23T14:39:54.000Z",
          "timestamp" : "Oct 23 22:39:54",
          "logsource" : "JN-AQHX",
          "type" : "syslog",
          "@version" : "1",
          "priority" : 134,
          "severity_label" : "Informational"
        }
3.1.2 服务器日志采集
以服务器172.76.20.121为例,采用rsyslog方式。将rsyslog收集的日志输出到es
提示
Rsyslog收集的日志会输出到一些文件中,如/var/log/目录中较多文件是由rsyslog输出。 因此,在filebeat配置中,不需要再配置这类日志的收集,以免重复收集。
3.1.2.1 配置
# echo "*.* @@172.76.20.119:7514" >> /etc/rsyslog.conf
# /etc/init.d/rsyslog restart
3.1.2.2 验证
查看命令
GET /syslog-2020.05.28-linux/_search
{
  "size":1,
  "query":{"match":{"host":"172.76.20.121"}},
  "sort":{"@timestamp":{"order":"desc"}}
}
结果
"_source" : {
          "host" : "172.76.20.121",
          "message" : """daemon: conn=1008208 fd=14 connection from IP=198.76.20.110:53502 (IP=0.0.0.0:34049) accepted.
""",
          "facility_label" : "local4",
          "severity" : 7,
          "facility" : 20,
          "@timestamp" : "2020-05-28T05:30:13.000Z",
          "timestamp" : "May 28 13:30:13",
          "program" : "slapd",
          "logsource" : "localhost",
          "type" : "syslog",
          "@version" : "1",
          "pid" : "8944",
          "priority" : 167,
          "severity_label" : "Debug"
        }
3.1.3 实例:命令日志收集及报警
3.1.3.1 配置环境变量
# vi /etc/profile
HISTTIMEFORMAT="%F %T "'
export PROMPT_COMMAND='{ msg=$( history 1 | { read x cmd;echo $cmd;}) ; logger -p local1.notice "ssh-user:$(who am i), Current-User:$(whoami), Current-Directory:`pwd`, cmd: $msg";}'

# source /etc/profile
3.1.3.2 配置rsyslog
在rsyslog中添加一行local1.notice /var/log/cmd.log,将命令日志单独写到一个日志文件中。
# sed -i '/^local7/a local1.notice       /var/log/cmd.log' /etc/rsyslog.conf
# echo "*.* @@172.76.20.119:7514" >> /etc/rsyslog.conf
# /etc/init.d/rsyslogd rstart
3.1.3.3 配置logstash
# cat syslog-linux.conf
input {
  syslog {
    host => "0.0.0.0"
    port => 7514
    type => "syslog"
  }
}

filter{
}

output {

  #output method 1: es
  elasticsearch {
    hosts => ["127.0.0.1:9200"]
    index => "syslog-%{+YYYY.MM.dd}-linux"
    #document_type => "syslog"
  }

  #output method 2: email
  #if (([message] =~ "rm") or ([message] =~ "yum"))
  if (([message] =~ "rm") or ([message] =~ "yum install") or ([message] =~ "vi /etc/profile") or ([message] =~ "vi /etc/rc.local"))
  {
     email {
            to => "guofs@os-w.com;guofs@139.com"
            from => "jszc_dsd@os-w.com"
            address => "198.218.32.152"
            port => "30025"
            username => "jszc_dsd@os-w.com"
            password => "abc_********"
            subject => "%{severity_label}/%{timestamp}--linux %{host}"
            body => "Hello,\n\n%{message},\n\n%{timestamp}"
            htmlbody => ""
     }
  }

}
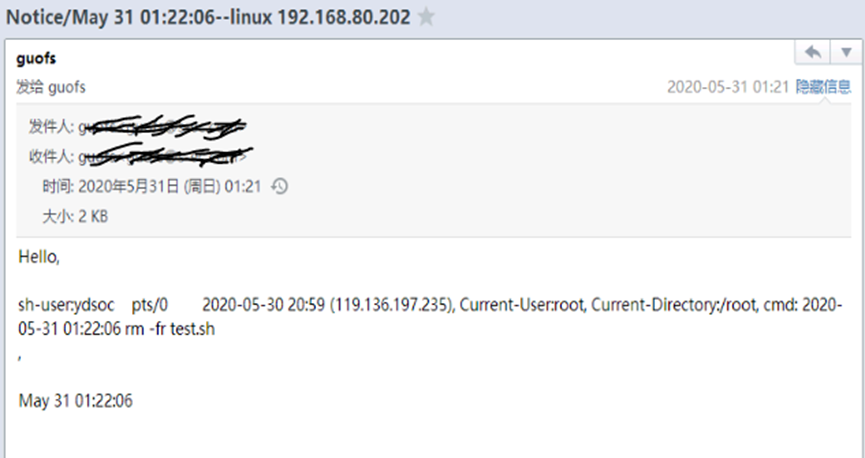
3.1.3.4 测试验证
- 执行报警条件的命令
# rm -fr text.sh
- 日志文件查看
# cat /var/log/cmd.log | grep test
May 31 01:22:06 ip202 root: sh-user:ydsoc    pts/0        2020-05-30 20:59 (119.136.197.235), Current-User:root, Current-Directory:/root, cmd: 2020-05-31 01:22:06 rm -fr test.sh
- es查看
        "_source" : {
          "facility_label" : "local1",
          "message" : """sh-user:ydsoc    pts/0        2020-05-30 20:59 (119.136.197.235), Current-User:root, Current-Directory:/root, cmd: 2020-05-31 01:05:45 rm -fr text.sh""",
          "severity_label" : "Notice",
          "@version" : "1",
          "severity" : 5,
          "program" : "root",
          "type" : "syslog",
          "priority" : 141,
          "timestamp" : "May 31 01:05:45",
          "logsource" : "ip202",
          "facility" : 17,
          "@timestamp" : "2020-05-31T01:05:45.000Z",
          "host" : "192.168.80.202"
        }
- 报警邮件接收
3.2 文件类型日志采集
3.2.1 安装filebeat采集服务
需要每个被采集端都需要安装,本例为172.76.20.121为例
3.2.1.1 安装
# tar xzvf filebeat-7.6.1-linux-x86_64.tar.gz
# mv filebeat-7.6.1-linux-x86_64 /opt/beat/filebeat
3.2.1.2 配置
此处为重点
# vi /opt/beat/filebeat/filebeat.yml
#=========================== Filebeat inputs =============================

filebeat:
  spool_size: 1024
  idle_timeout: "5s"

  tail_files: true
  backoff: "1s"
  scan_frequency: "10s"
  harvester_buffer_size: 16384
  #ignore_older: "24h"


filebeat.inputs:

- type: log
  enabled: true
  paths:
      - /var/log/audit/*
  tags: ["filelog_audit"]

- type: log
  enabled: true
  paths:
      - /var/log/chrony
  tags: ["filelog_chrony"]

- type: log
  enabled: true
  paths:
      - /var/log/cmdlog/*
  tags: ["filelog_cmdlog"]

- type: log
  enabled: true
  paths:
      - /var/log/cron
  tags: ["filelog_cron"]

- type: log
  enabled: true
  paths:
      - /var/log/dmesg
  tags: ["filelog_dmesg"]

- type: log
  enabled: true
  paths:
      - /var/log/httpd/*log
  tags: ["filelog_apache"]

- type: log
  enabled: true
  paths:
      - /usr/local/nginx/log/*
  tags: ["filelog_nginx"]


- type: log
  enabled: true
  paths:
      - /var/log/messages
  tags: ["filelog_messages"]

- type: log
  enabled: true
  paths:
      - /var/log/secure
  tags: ["filelog_secure"]

- type: log
  enabled: true
  paths:
      - /var/log/yum.log
  tags: ["filelog_yum"]
#============================== Kibana =====================================
#setup.kibana:
  #host: "http://172.76.20.146:5601"

#================================ Outputs =====================================
#----------------------------- Logstash output --------------------------------
output.logstash:
  # The Logstash hosts
  #hosts: ["localhost:5044"]
  hosts: ["172.76.20.119:5044"]
3.2.1.3 添加es索引模板和仪表盘
# /opt/beat/filebeat/filebeat setup \
--path.config /opt/beat/filebeat \
-E output.logstash.enabled=false \
-E output.elasticsearch.hosts="172.76.20.119:9200" \
-E setup.kibana.host="172.76.20.146:5601" \
-E setup.ilm.overwrite=true \
-E setup.template.fields="fields.yml" \
-E setup.template.overwrite=true \
-E setup.template.settings.index.number_of_shards=2 \
-E setup.template.settings.index.number_of_replicas=1
提示
es索引模板和仪表盘只需添加一次即可,不需要每台采集点都运行上述命令。
3.2.1.4 启动
# /opt/beat/filebeat/filebeat run --path.config /opt/beat/filebeat &
3.2.1.5 验证
- 索引模板查看
GET /_template/filebeat-7.6.1
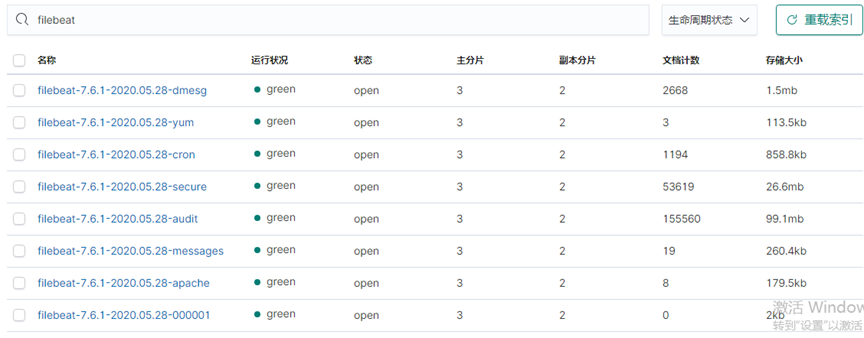
- 索引列表查看
在Kibana中可查验是否有日志产生,如下:
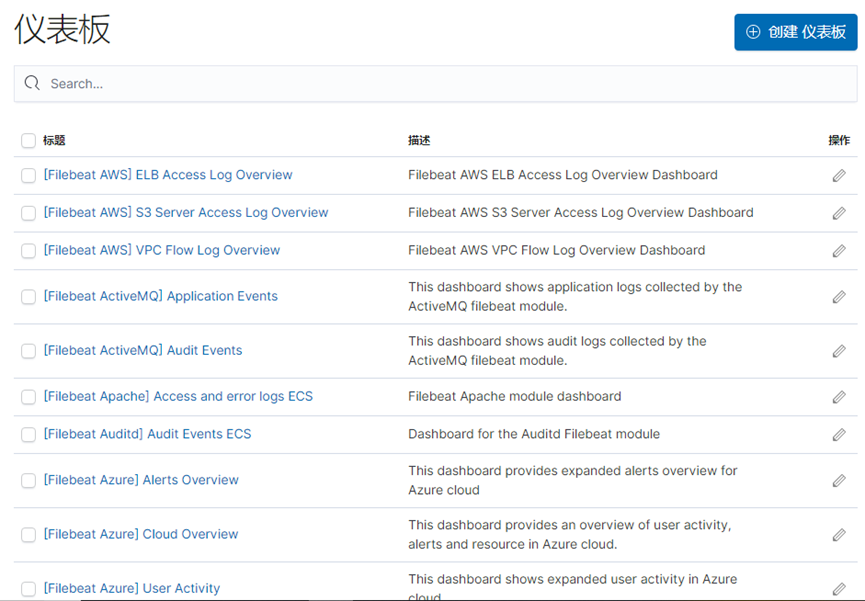
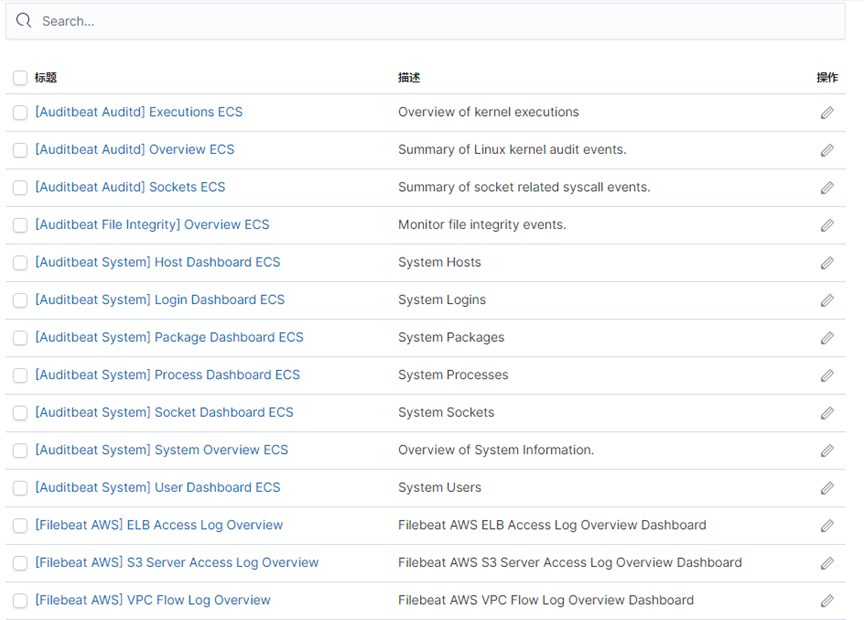
- 仪表盘模板查看
3.2.2 实例一:日志/var/log/messages采集
3.2.2.1 配置
- type: log
  enabled: true
  paths:
      - /var/log/messages
  tags: ["filelog_messages"]
3.2.2.2 验证
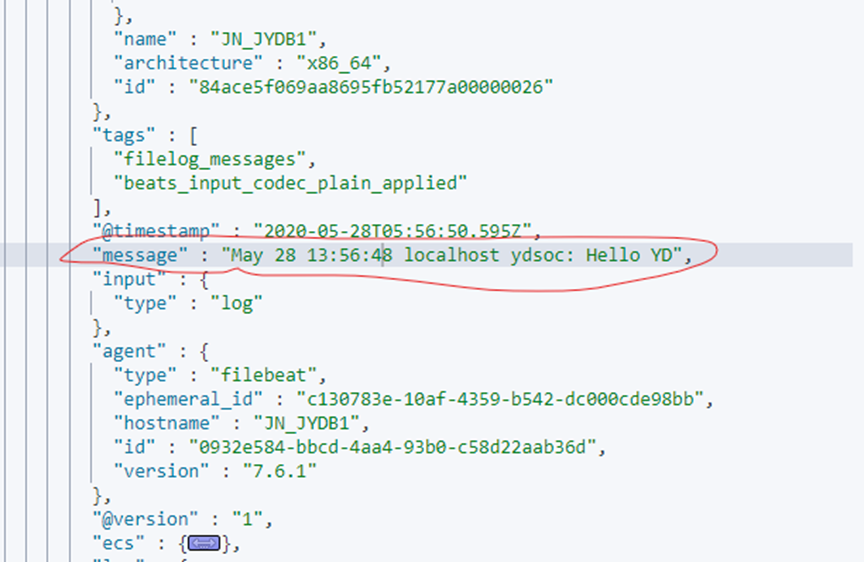
- 注入日志
logger -p err "Hello YD"
- 查看命令
GET /filebeat-7.6.1-2020.05.28-messages/_search
{
  "size":20,
  "query":{"match":{"host.name":"JN_JYDB1"}},
  "sort":{"@timestamp":{"order":"desc"}}
}
- 结果
3.2.3 实例二:命令日志采集
以192.168.80.202为例
3.2.3.1 命令日志文件产生
将如下内容添加到/etc/profile文件:
LOGNAME=/var/log/cmdlog
if [ ! -d  ${LOGNAME} ]
then
mkdir -p ${LOGNAME}
chmod 777 ${LOGNAME}
fi
export HISTORY_FILE="${LOGNAME}/cmdrecord"
export PROMPT_COMMAND='{ date "+%Y-%m-%d %T###$(who am i)###${USER}###$(history 1 | { read x cmd; echo "$cmd"; })"; } >>$HISTORY_FILE'
#export PROMPT_COMMAND='{ date +"%Y%m%d %H:%M:%S [$(who am i | tr -s [[:blank:]] | cut -d" " -f1,2,5)-> ${USER}] $( history 1 | { read num cmd; echo ${cmd}; })" ; } >> /var/log/secure'
#export PROMPT_COMMAND="{ date \"+%Y-%m-%d %T###\$(who am i)###\${USER}###\$(history 1 | { read x cmd; echo \"\$cmd\"; })\"; } >>\$HISTORY_FILE"
###
查看日志

3.2.3.2 日志写入es
配置filebeat.yml文件
- type: log
  enabled: true
  paths:
      - /var/log/cmdlog/*
  tags: ["filelog_cmdlog"]
3.2.3.3 验证
- 查看命令
GET /filebeat-7.6.1-2020.05.28-cmdlog/_search
{
  "size":10,
  "query":{"match":{"host.name":"JN_JYDB1"}},
  "sort":{"@timestamp":{"order":"desc"}}
}
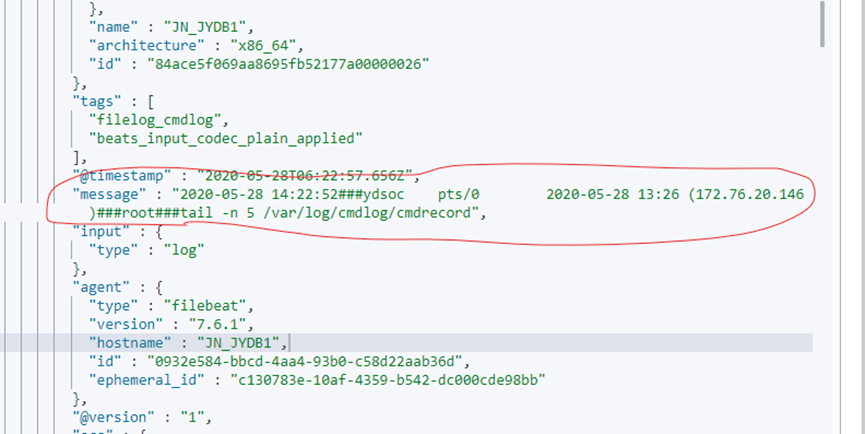
- 结果
3.2.4 实例三:Apache日志采集
3.2.4.1 配置
- type: log
  enabled: true
  paths:
      - /var/log/httpd/*log
  tags: ["filelog_apache"]
3.2.4.2 验证
查看命
GET /filebeat-7.6.1-2020.05.28-apache/_search
{
  "size":10,
  "query":{"match":{"host.name":"JN_JYDB1"}},
  "sort":{"@timestamp":{"order":"desc"}}
}
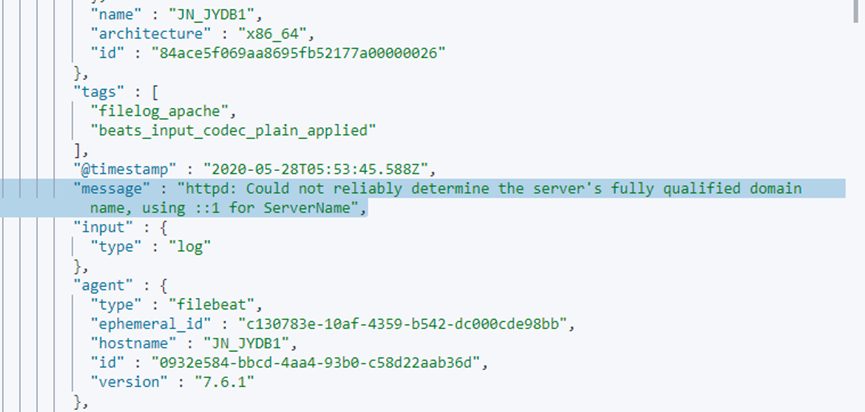
结果
3.3 审计数据采集
3.3.1 采集服务安装
tar zxvf auditbeat-7.6.1-linux-x86_64.tar.gz
mv auditbeat-7.6.1-linux-x86_64 /opt/beat/auditbeat
3.3.2 配置
vi /opt/beat/auditbeat/auditbeat.yml内容如下
#==========================  Modules configuration =============================
auditbeat.modules:

- module: auditd
  # Load audit rules from separate files. Same format as audit.rules(7).
  #audit_rule_files: [ '${path.config}/audit.rules.d/*.conf' ]
  audit_rules: |
    ## Identity changes.
    -w /etc/group -p wa -k identity
    -w /etc/passwd -p wa -k identity
    -w /etc/gshadow -p wa -k identity
-w /root/test.txt -p wa -k identity
  tags: ["audit_auditd"]

- module: file_integrity
  paths:
  - /bin
  - /usr/bin
  - /sbin
  - /usr/sbin
  - /etc
  - /user-dir
  tags: ["audit_file"]

- module: system
  datasets:
    - host    # General host information, e.g. uptime, IPs
    - login   # User logins, logouts, and system boots.
    - package # Installed, updated, and removed packages
    - process # Started and stopped processes
    #- socket  # Opened and closed sockets
- user    # User information
tags: ["audit_system"]

#============================== Kibana =====================================
#setup.kibana:
  #host: "http://172.76.20.146:5601"

#================================ Outputs =====================================
#----------------------------- Logstash output --------------------------------
output.logstash:
  # The Logstash hosts
  hosts: ["172.76.20.119:5044"]
3.3.3 添加es索引模板和仪表盘
# /opt/beat/auditbeat/auditbeat setup \
--path.config /opt/beat/auditbeat \
-E output.logstash.enabled=false \
-E output.elasticsearch.hosts="172.76.20.119:9200" \
-E setup.kibana.host="172.76.20.146:5601" \
-E setup.ilm.overwrite=true \
-E setup.template.fields="fields.yml" \
-E setup.template.overwrite=true \
-E setup.template.settings.index.number_of_shards=2 \
-E setup.template.settings.index.number_of_replicas=1
提示
es索引模板和仪表盘只需添加一次即可,不需要每台采集点都运行上述命令。
3.3.4 启动
/opt/beat/auditbeat/auditbeat run --path.config /opt/beat/auditbeat &
3.3.5 验证
3.3.5.1 查看kibana
- 索引模板查看
GET /_template/auditbeat-7.6.1
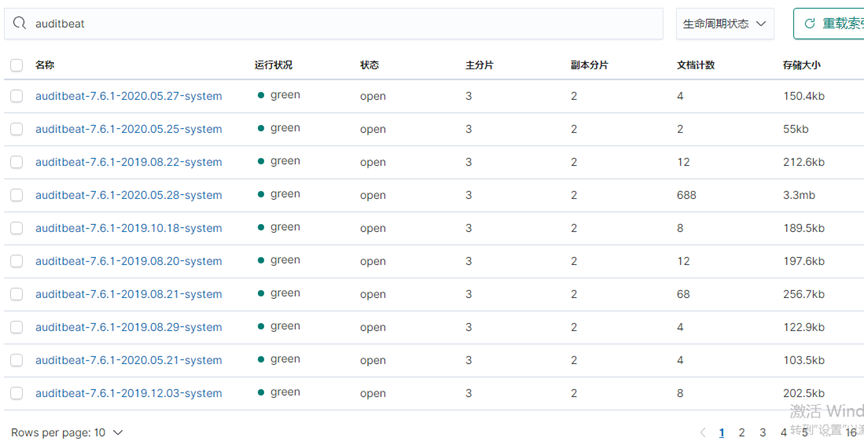
- 索引表
- 仪表盘
3.3.5.2 查看记录写入
- 触发审计条件
useradd gfs
- 查看命令
GET /auditbeat-7.6.1-2020.05.27-system/_search
{
  "size":10,
  "query":{"match":{"host.name":"ip202"}},
  "sort":{"@timestamp":{"order":"desc"}}
}
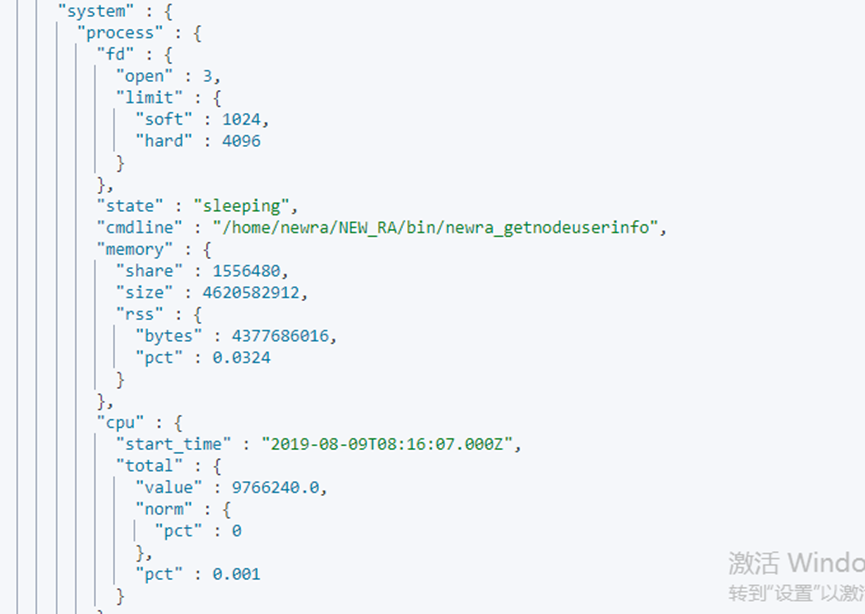
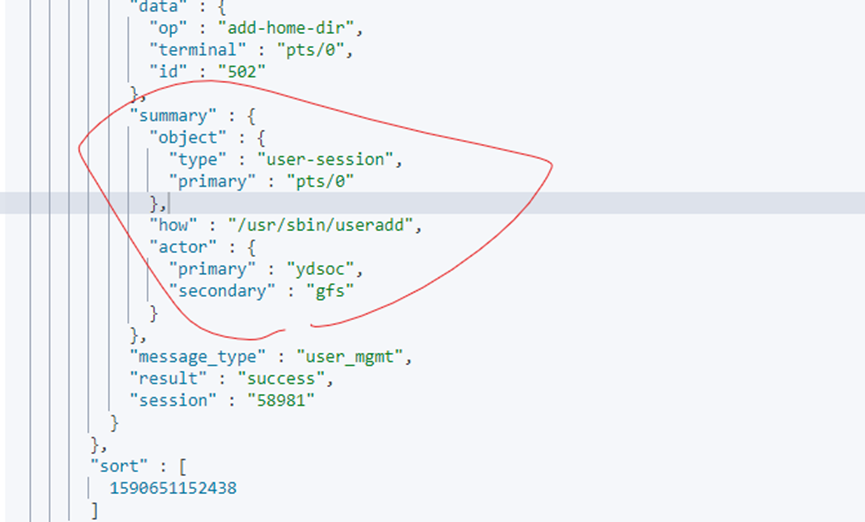
- 结果
        "_source" : {
          "auditd" : {
            "data" : {
              "id" : "1002",
              "terminal" : "pts/0",
              "op" : "add-home-dir",
              "hostname" : "ip202"
            },
            "result" : "success",
            "summary" : {
              "how" : "/usr/sbin/useradd",
              "object" : {
                "primary" : "pts/0",
                "secondary" : "ip202",
                "type" : "user-session"
              },
              "actor" : {
                "primary" : "unset",
                "secondary" : "gfs"
              }
            },
          "tags" : [
            "audit_auditd",
            "beats_input_raw_event"
          ],
3.3.6 实例一:内核auditd审计方式
3.3.6.1 配置
- module: auditd
  #audit_rule_files: [ '${path.config}/audit.rules.d/*.conf' ]
  audit_rules: |
    ## Identity changes.
    -w /etc/group -p wa -k identity
    -w /etc/passwd -p wa -k identity
    -w /etc/gshadow -p wa -k identity
    -w /root/test.txt -p wa -k identity
3.3.6.2 验证
- 触发审计条件
useradd gfs
- 查看命令
GET /auditbeat-7.6.1-2020.05.28-auditd/_search
{
  "size":10,
  "query":{"match":{"host.hostname":"JN_JYDB1"}},
  "sort":{"@timestamp":{"order":"desc"}}
}
- 结果
3.3.7 实例二:目录审计
3.3.7.1 配置
- module: file_integrity
  paths:
  - /bin
  - /usr/bin
  - /sbin
  - /usr/sbin
  - /etc
  - /user-dir
  tags: ["audit_file"]
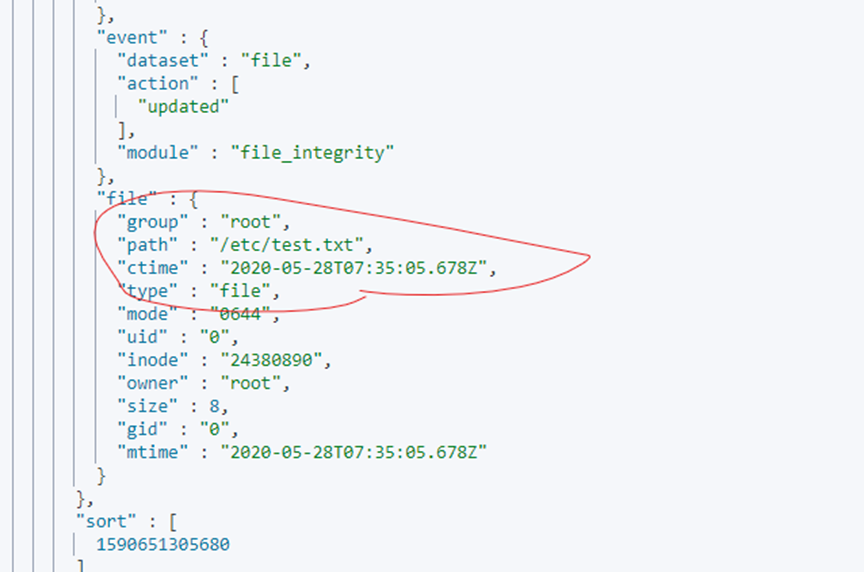
3.3.7.2 验证
- 触发审计条件
echo "test v1" > /etc/test.txt
- 查看命令
GET /auditbeat-7.6.1-2020.05.28-file/_search
{
  "size":10,
  "sort":{"@timestamp":{"order":"desc"}}
}
- 查看命令
3.3.8 实例三:系统信息审计
3.3.8.1 配置
- module: system
  datasets:
    - host    # General host information, e.g. uptime, IPs
    - login   # User logins, logouts, and system boots.
    - package # Installed, updated, and removed packages
    - process # Started and stopped processes
    - socket  # Opened and closed sockets
    - user    # User information

  # How often datasets send state updates with the
  # current state of the system (e.g. all currently
  # running processes, all open sockets).
  state.period: 2h

  # Enabled by default. Auditbeat will read password fields in
  # /etc/passwd and /etc/shadow and store a hash locally to
  # detect any changes.
  user.detect_password_changes: true

  # File patterns of the login record files.
  login.wtmp_file_pattern: /var/log/wtmp*
  login.btmp_file_pattern: /var/log/btmp*

  tags: ["audit_system"]
3.3.8.2 验证
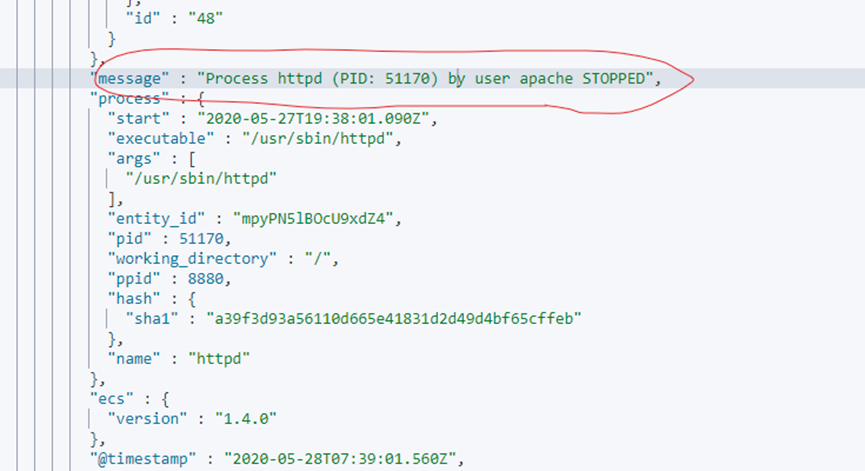
- 触发审计条件
/etc/init.d/httpd stop
中止某个进程
- 查看命令
GET /auditbeat-7.6.1-2020.05.28-system/_search?q="STOPPED"
{
  "size":20,
  "sort":{"@timestamp":{"order":"desc"}}
}
- 结果
3.4 系统数据采集
3.4.1 采集服务安装
tar zxvf metricbeat-7.6.1-linux-x86_64.tar.gz
mv metricbeat-7.6.1-linux-x86_64 /opt/beat/metricbeat
3.4.2 配置
vi /opt/beat/metricbeat/metricbeat.yml内容如下
#==========================  Modules configuration ============================

metricbeat.config.modules:
  # Glob pattern for configuration loading
  path: ${path.config}/modules.d/*.yml

  # Set to true to enable config reloading
  reload.enabled: true

  # Period on which files under path should be checked for changes
  #reload.period: 10s
#================================ General =====================================
tags: ["metric-host", "metric-host-ip205"]
#================================ Outputs =====================================
output.logstash:
  # The Logstash hosts
  hosts: ["192.168.80.190:5044"]
提示
目录/opt/beat/metricbeat/modules.d/有较多指标模板,若开启,只需改名即可。 如mysql、zabbix、apache、nginx等
3.4.3 添加es索引模板和仪表盘
# /opt/beat/metricbeat/metricbeat setup \
--path.config /opt/beat/metricbeat \
-E output.logstash.enabled=false \
-E output.elasticsearch.hosts="172.76.20.119:9200" \
-E setup.kibana.host="172.76.20.146:5601" \
-E setup.ilm.overwrite=true \
-E setup.template.fields="fields.yml" \
-E setup.template.overwrite=true \
-E setup.template.settings.index.number_of_shards=2 \
-E setup.template.settings.index.number_of_replicas=1
提示
es索引模板和仪表盘只需添加一次即可,不需要每台采集点都运行上述命令。
3.4.4 启动
/opt/beat/metricbeat/metricbeat run --path.config /opt/beat/metricbeat &
3.4.5 验证
3.4.5.1 查看kibana
- 索引模板
GET /_template/metricbeat-7.6.1
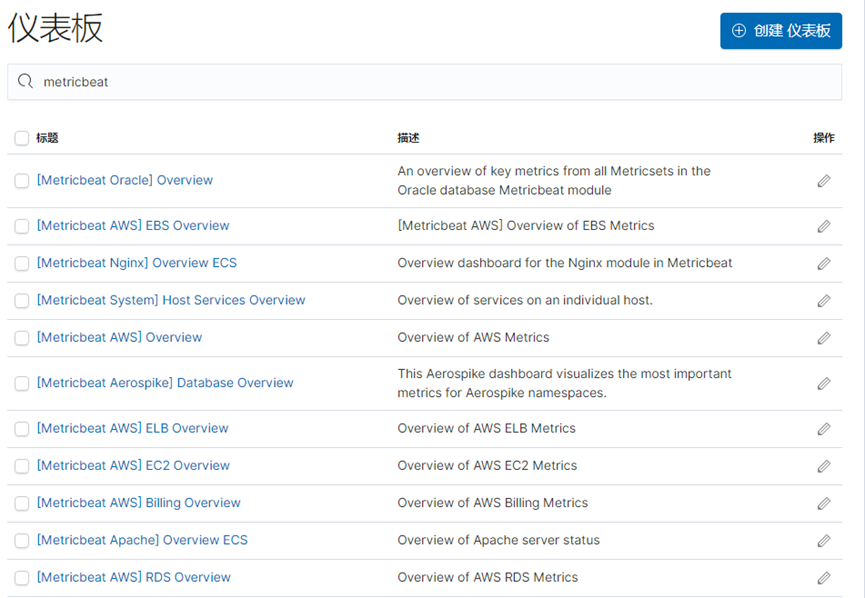
- 仪表盘
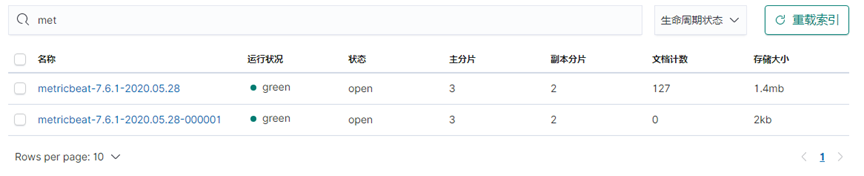
- 索引表
3.4.5.2 查看记录写入
- 查看命令
GET /metricbeat-7.6.1-2020.05.28/_search
{
  "size":10,
  "query":{"match":{"host.hostname":"JN_JYDB1"}},
  "sort":{"@timestamp":{"order":"desc"}}
}
- 结果